Key Findings
The synthesis ties four TMG sports studies to six peer-reviewed business research sources plus one industry research source. This page summarizes what each side of that synthesis shows and how they connect.
For source-by-source detail, see the business research page. For what this means in practice, see the implications page. For what this synthesis can and cannot claim, and to verify any claim yourself, see the audit page.
What the sports work showed
The four TMG sports studies organize cleanly into two pairs. One pair tests the team-level question: does spending more in free agency produce more wins. The other pair tests the player-level question: do players who stay outperform players who move.
Team level: spending does not reliably predict wins
NHL Free Agency Research. Nine seasons. 1,648 unrestricted free agent signings. 284 team-seasons. After controlling for prior season performance, offseason UFA spending does not significantly predict next-season change. Mean reversion dominates. The slope of prior finish to next-season change is -0.42 (p < 0.001). Read the NHL research.
NFL Analysis. Ten seasons. 643 player moves. In most seasons the team that spent the most in free agency did not produce the biggest win gain. Roster construction decisions, including which positions are targeted and how efficiently, appear to matter more than total dollars spent. Read the NFL research.
Player level: staying outperforms moving
NBA Analysis. Eight seasons of rotation players. Three groups: stayed, changed teams, signed supermax. The supermax penalty is a mirage. It disappears once age and prior performance are controlled for. Players who changed teams declined more than players who stayed. Read the NBA research.
NHL Play for Contract. Contract timing study of NHL skater usage and value. Same-team contracts deliver more time on ice per dollar of cap share than new-team signings. The tier-controlled same-team coefficient is +0.70 minutes per game-equivalent (p < 0.0001). The finding is called a loyalty discount. Read the NHL Play for Contract research.
All four findings point the same direction. Where a player or team starts matters more than how much money changes hands, and retaining outperforms acquiring on a per-dollar basis.
What the business research says
Six peer-reviewed sources frame the answer. Four address the buyer side of the talent market. Two test the conditions under which talent does transfer.
Stars rarely keep their edge after switching firms
Boris Groysberg studied more than 1,000 star Wall Street analysts at 78 investment banks. Stars who switched firms suffered an immediate and lasting decline in performance. Excellence depended on firm-specific resources, networks, and colleagues. The exceptions were stars who moved with their teams, stars who moved to firms with higher capabilities and resources, and female stars.
The NBA finding that players who change teams decline more than players who stay is the sports version of this. The NHL Play for Contract loyalty discount is another version. System, role, teammates, and coaching are not portable, and the data shows it across two sports at the player level.
External hires cost more and produce less
Matthew Bidwell studied internal versus external hires at the same jobs. External hires were paid around 18 percent more than internal promotions. They received significantly lower performance evaluations during their first two years. Exit rates were higher.
The TMG sports data shows the same pattern at both the team and player level. NHL and NFL teams that spend more in free agency do not reliably win more. NHL Play for Contract finds same-team signings deliver more time on ice per cap share than new-team signings. The buyer pays more and gets less per dollar, whether the buyer is a firm or a front office.
Buyers overpay because they overestimate themselves, and experience does not correct it
Richard Roll's hubris hypothesis explains why companies keep paying premiums for acquisitions even though acquirer returns are zero or negative on average. Bidders trust their own valuation more than the market's. They are usually wrong.
Boivie, Gee, Gentry, and Graffin (2025) sharpen the mechanism. Studying S&P 1500 firms from 1999 to 2020, they find that boards with more CEO-hiring experience produce slightly worse subsequent selections, not better. Experience does not correct the buyer-side error.
This is the mechanism. Front offices and HR departments share the same buyer-side blind spot, and repeated practice does not fix it.
When talent does transfer
Two peer-reviewed sources test Groysberg's exception. Both find that performance transfers more readily when the value-creating asset is portable.
Insurance salespeople build books because books move
Berry-Stolzle and Eckles studied property-liability insurance salespeople. The average policy renewal rate is 89 percent. The book of business is a portable asset, and salespeople build books explicitly because they can take them.
About 40 percent of client assets follow financial advisors
Gurun, Stoffman, and Yonker studied over 760,000 financial advisors managing $28 trillion in assets. They used the 2004 creation of the Protocol for Broker Recruiting (commonly called the Broker Protocol) as exogenous variation in client transferability. About 40 percent of client assets follow advisors when they move. The relationship is partly portable.
These two sources are the counterpoint. When the asset is the relationship and the client comes with you, talent transfers materially. When the asset is firm infrastructure or team context, it does not.
The portability spectrum
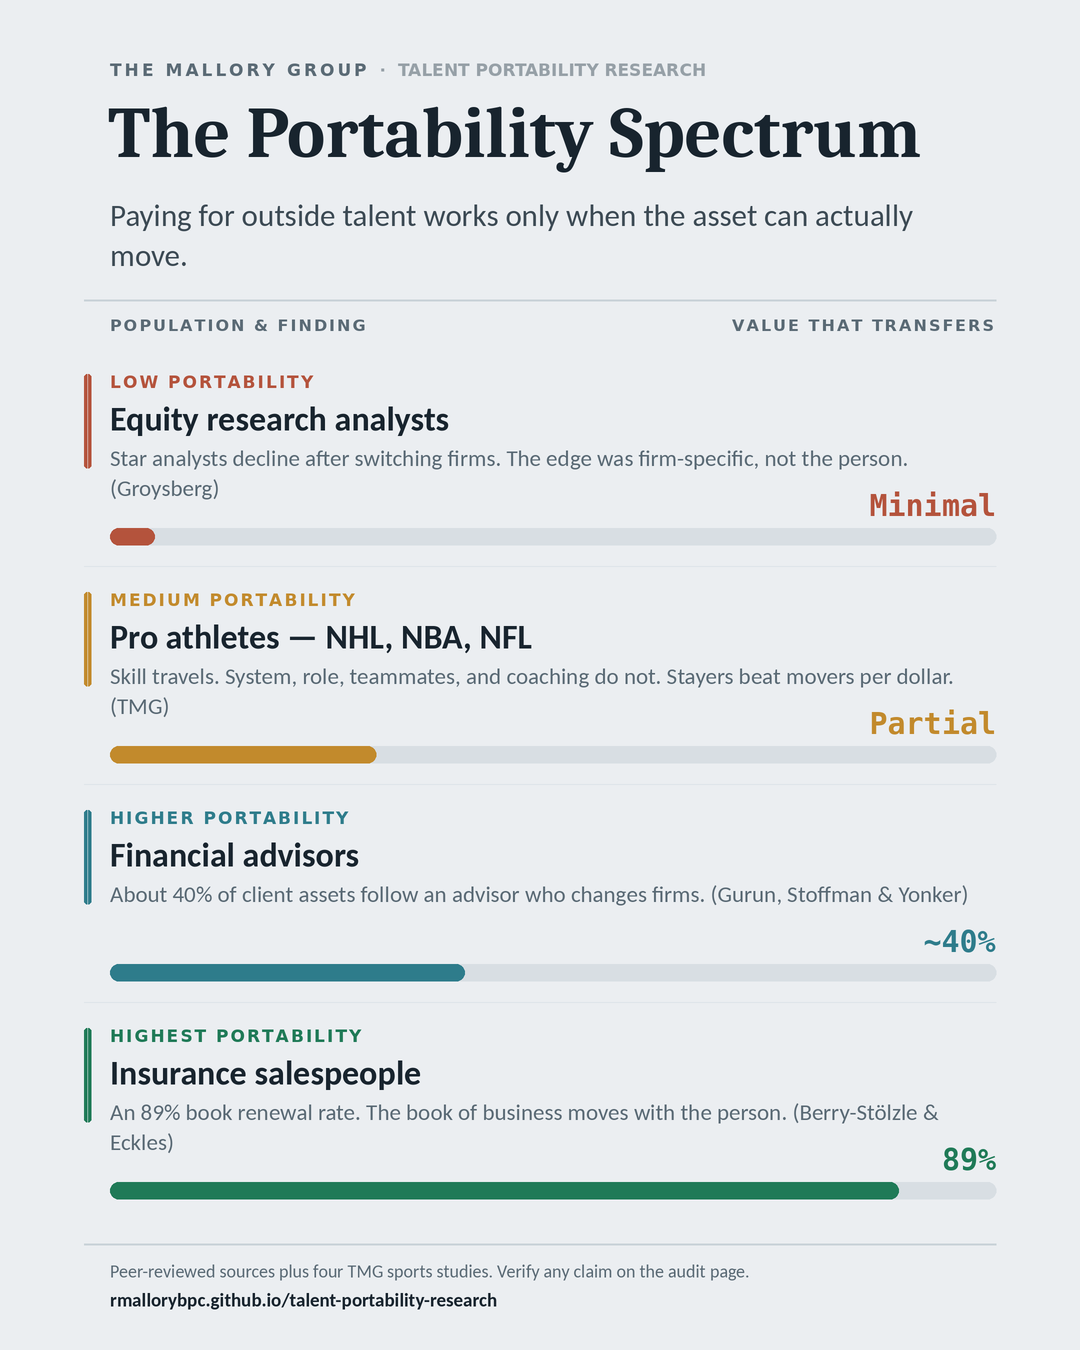
There is a spectrum across populations, anchored in peer-reviewed evidence:
- Low portability. Equity research analysts (Groysberg, 2010). Stars lose their edge when they leave the firm.
- Medium portability. NHL, NBA, and NFL players and teams (TMG sports research). Skill transfers. System fit, role, teammates, and coaching do not. Internal hires and same-team signings outperform external acquisitions on a per-dollar basis.
- Higher portability. Financial advisors (Gurun, Stoffman, and Yonker, 2021). About 40 percent of client assets follow.
- Highest portability. Property-liability insurance salespeople (Berry-Stolzle and Eckles, 2019). Book renewal rate of 89 percent supports strong revenue portability.
The question is not whether paying for talent ever works. It is whether the asset you are paying for actually transfers.
Three implications
Three implications. The full version is on the implications page.
- Before paying a premium for outside talent, identify the value-creating asset. Is it portable, or is it firm-specific?
- The buyer side of these transactions is the one most consistently wrong. Hubris in your own valuation is the mechanism behind most overpayment.
- The sports data and the business research are pointing the same direction. That convergence is the story.
Where to go next
- Back to welcome.
- Business Research: source-by-source detail.
- Implications: what this means in practice.
- Citations: full bibliography.
- Audit: what this synthesis can and cannot claim, and verify any claim yourself.